DESIGN FOR PRINT

DESIGN FOR WEB

IMAGE EDITING

GRAPHICS & ANIMATION

ABOUT / CONTACT

Go to home of hand2mouse-

PORTFOLIO OF

INFOGRAPHICS

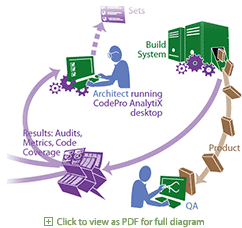
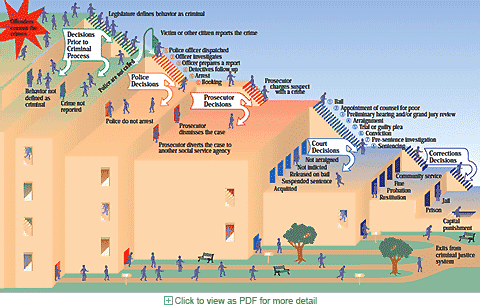
Nancy Wirsig McClure specializes in making complex concepts accessible.
She creates diagrams of processes & how things work, timelines, maps,and numerically-based charts and graphs.
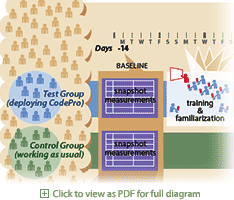
She particuarly likes to redraw boxes-and-arrows diagrams as more pictorial, explanatory graphics.

In each example on this page, Nancy came up with the concept and style from the brief,
planned the layout, drew the artwork, and produced it as a digital file.

Infographic (vector): Software development steps Diagrams (vector, large set) for criminology textbook Infographic (vector): pellet fuel from scrap to home heating
Infographic (vector): Pilot Evaluation Process Map (vector) of approaches and parking, Landmark Center Infographic (vector): Shade in different seasons
Infographic (vector): how to make a timer from soda bottles Infographic (vector): how bilge cleaning works Chart: market shares for soybean growers
Infographic (vector): Timeline for a construction project Chart (vector): injuries from bike accidents
diagram of digestion for nutrition textbook Infographic (vector): How the justice sytem handles offenders - diagram for criminology textbook
Infographic (vector): object-oriented software -- beyond boxes and arrows Infographic (vector) for nutrition textbook: development of cancer cells Infographic (vector): How a 1990s pager device worked